F-score Deep Dive
An alternative method for choosing beta in the F-score
Recently at work we had a project where we used genetic algorithms to evolve a model for a classification task. Our key metrics were precision and recall, with precision being somewhat more important than recall (we didn’t know exactly how much more important at the start). At first we considered using multi-objective optimization to find the Pareto front and then choose the desired trade-off, but it proved impractical due to performance issues. So we had to define a single metric to optimize.
Since we were using derivative-free optimization we could use any scoring function we wanted, so the F-score was a natural candidate.
It ended up working quite well, but there were some tricky parts along the way.
General background
Accuracy (% correct predictions) is a classical metric for measuring the quality of a classifier. But it’s problematic for many classification tasks, most prominently when the classes
aren’t balanced or when we want to differently penalize false positives vs. false negatives.
Precision and recall separate the model quality measurement to two metrics, focusing on false positives and false negatives, respectively. But then comparing models becomes less trivial -
is 80% precision, 60% recall better or worse than 99% precision, 40% recall?
Taking the average is a possibility; let’s see how it does:
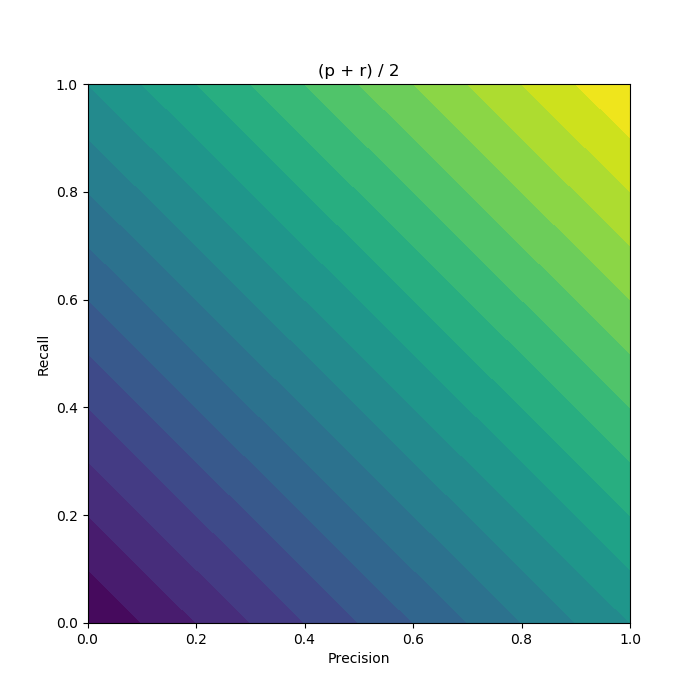
So if we have a model with 0% precision and 100% recall, the average is a score of 50%. Such a model is completely trivial from a prediction point of view (always predict positive), so ideally it should have a score of 0%. More generally, we see that the average exhibits a linear tradeoff policy: you can stay on the same score by simultaneously increasing one metric and decreasing the other by the same amount. When the metrics are close this could make sense, but when there’s a big difference it starts to deviate from intuition.
F-score to the rescue
The F1-score is defined as the harmonic mean of precision and recall:
\[F_1 = \frac{2}{\frac{1}{p} + \frac{1}{r}}\]Let’s visualize it:
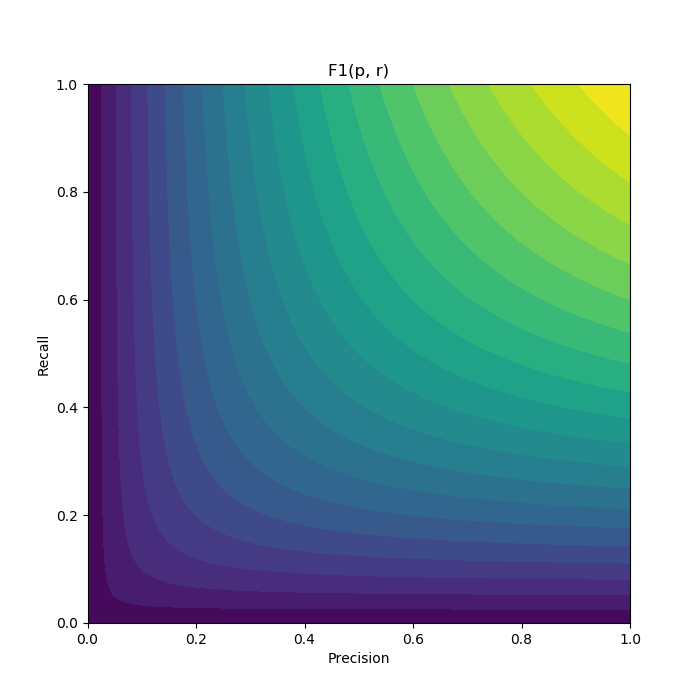
This seems much more appropriate for our needs: when there’s a relatively small difference between precision and recall (e.g. along the y = x line), the score behaves like the average.
But as the difference gets bigger, the score gets more and more dominated by the weaker metric, and further improvement on the already strong metric doesn’t improve it much.
So this is a step in the right direction. But now how do we adjust it to prefer some desired tradeoff between precision and recall?
Some history and the beta parameter
As far as I understand, the F-score was derived from the book Information Retrieval by C. J. van Rijsbergen, and popularized in a Message Understanding Conference in 1992. More details on the derivation can be found here. The full derivation of the measure includes a parameter, beta, to control exactly what we’re looking for - how much we prefer one of the metrics over the other. This is also what the ‘1’ in F1 stands for - no preference for either (a value between 0 and 1 indicates a preference towards precision, and a value larger than 1 indicates a preference towards recall). Here is the full definition:
Visualizing the F-score
First, to develop some intuition regarding the effect of beta on the score, here’s an interactive plot to visualize the F-score for different values of beta. Play with the “bands” parameter to explore how different betas create different areas of (relative) equivalence in score.
Beta: 0.01 100
Bands: 5 100
Choosing a beta
According to the derivation, a choice of beta equal to the desired ratio between recall and precision should be optimal. In this case, if I understood the math correctly, optimality is defined as following: take the F-score function for some beta, which is simply a function with two variables. Find its partial derivatives with respect to recall and precision. Now find a place where those partial derivatives are equal, that is, a point on the precision-recall plane where a change in one metric is equivalent to (will lead to the same change as) a change in the other metric. The F-score function is structured in such a way that when beta = recall / precision, this point of equivalence lies on the straight line passing through the origin with a slope of recall / precision. In other words, when the ratio between recall and precision is equal to the desired ratio, a change in one metric will have the same effect as an equal change in the other. I sort of get the intuition behind this definition, but I’m not convinced it captures the essence of optimality anyone using the F-score might find useful.
Taking a closer look
When trying to set beta = desired ratio, the results seemed a little off from what I would expect, and I wanted to make sure the value we’ve chosen for beta really was optimal for our use case. I went on a limb here, and the next part is rather hand-wavy, so I’m not convinced this was the right approach. But here it is anyway.
Imagine the optimizer: crunching numbers, navigating a vast, multidimensional space of classifiers. The navigation is guided by a short-sighted mechanism of offsprings and mutations, with each individual classifier being mapped to the 2d plane of precision and recall, and from there to the 1d axis of the F-score. Better classifiers propagate to future generations, slowly moving the optimizer to better sections of the solution space.
Now imagine this navigation on the precision-recall plane. The outcome is governed by two main factors: the topology of the solution space (how hard it is to achieve a certain combination of precision and recall) and the gradients of the F-score (how “good” it is to achieve a certain combination of precision and recall). We can imagine the solution topology as an uneven terrain on which balls (solutions) are rolling and the F-score as a slight wind pushing the balls in desired directions. We would then like the wind to always push in the direction bringing solutions to our desired ratio.
Let’s try to investigate the F-score under this imaginative and wildly unrigorous intuition: we have no idea how the solution topology looks like (though if we did multi-objective optimization we could get a rough sketch, e.g. by looking at the Pareto front at each generation), so we’ll focus on the direction of the F-score “wind”. To do that we’ll need to find the partial derivatives of the F-score w.r.t. precision and recall:
We got very similar-looking partial derivatives: let’s take a look at the “slope” to which the score is pushing at any given point:
\[\frac{^{\partial F}/_{\partial r}}{^{\partial F}/_{\partial p}} = \frac{\beta^2p^2}{r^2} = (\beta \cdot \frac{p}{r})^2\]Interesting: the direction at which the score is pushing is constant along straight lines from the origin (though the direction itself usually isn’t along the line).
And we can think of one such line where we would like the direction to be along that line: the line where r / p = R, our desired ratio. On that line the slope should be equal to R as well, so we get:
So we have a different definition of optimality which yields a different ideal value for beta.
Conclusion
I’m not sure how important this deep plunge to the maths of the F-score is to cases where you don’t have an unusual desired tradeoff between precision and recall, or when you’re just using the F-score to measure a classifier that’s trained by a different loss function. Usually you’re probably safe with going with F1, F0.5 or F2.
But I certainly feel I have a better understanding of how and why the F-score works, and how to better adjust it for a given scenario.